Carbon Intensity of Electricity: UK vs The World
Recently, we have been researching new ways to gauge how well the UK is doing in its mission to decarbonise its economy.
And we have stumbled upon a particularly interesting method that can summarise a country’s electricity generation carbon emissions in a single measurement: the carbon intensity of electricity.
And conveniently, our friends over at ourworldindata.org have collated the data and open-sourced it for us to independently assess the UK’s performance.
In this article, we explain the Carbon Intensity of Electricity (CIE) in detail using everyday examples, and we compare the UK’s CIE to that of Europe and the rest of the world to see how good we truly are on the world stage.
Contents
- What is the carbon intensity of electricity (CIE)?
- What is the UK’s carbon intensity of electricity?
- Carbon intensity of electricity: UK vs Europe
- Carbon intensity of electricity: UK vs World
- Conclusion: The UK doesn’t suck
What is the carbon intensity of electricity (CIE)?
The CIE concept has its roots in “intensity” measurements, which measure the rate of something. Examples include solar radiation ‘intensity’, or even the ‘intensity’ of social media reactions to headlining news.
Carbon intensity in the context of emissions measures the rate at which CO2 is emitted per unit of energy of a process. This could be the carbon intensity of the aviation industry, agriculture, or a car.
The carbon intensity of electricity specifically deals with the average CO2 emitted in grams per kWh of electricity generated in a country for a whole year and includes the entire mix of power generation technologies simultaneously.
Having a single number for each country makes it very easy to compare as any changes in a country’s adoption of low-carbon energy (i.e. nuclear or renewables) reduce its CIE while continuing to use fossil fuels increases the CIE.
The table below exemplifies this giving us generalized carbon intensity values for typical electricity generation methods:
| Technology | Median carbon intensity (gCO2eq/kWh) |
|---|---|
| Coal | 1001 |
| Natural Gas | 469 |
| Biomass | 230 |
| Solar (Polycrystalline Silicon PV) | 46 |
| Geothermal (Hot dry rock) | 45 |
| Solar Thermal | 22 |
| Nuclear | 16 |
| Wind (Onshore) | 12 |
| Large-scale hydroelectric | 4 |
Source: IPCC
As global climate agreements have made signatory countries legally bound to reduce their emissions to net zero by 2050, the hope is that the CIE of all countries goes down.
What is the UK’s carbon intensity of electricity?
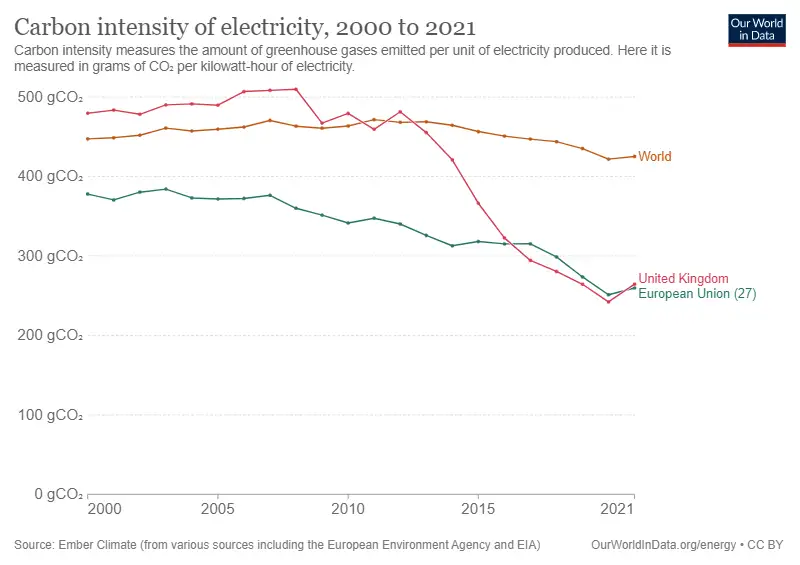
The carbon intensity of electricity (CIE) of the UK in 2021 (the most recent figure) was 265 grams of CO2 per kWh, which almost halved compared to its 2008 CIE of 510 grams of CO2 per kWh.
To exemplify the significance of this decrease to our everyday carbon footprint, we have used these CIE figures to calculate and compare the carbon footprint of typical household electrical appliances, in the table below.
| Appliance | kWh/year (based on average use) | Carbon footprint (based on the UK's 2008 C.I. of 510 gCO2/kWh) | Carbon footprint (based on the UK's 2021 C.I. of 265 gCO2/kWh) |
|---|---|---|---|
| LCD TV | 460 kWh/year | 235 kgCO2/year | 122 kgCO2/year |
| Fridge Freezer (A spec) | 408 kWh/year | 208 kgCO2/year | 108 kgCO2/year |
| Tumble Dryer | 370 kWh/year | 189 kgCO2/year | 98 kgCO2/year |
| Electric hob | 301 kWh/year | 154 kgCO2/year | 80 kgCO2/year |
| Electric oven | 211 kWh/year | 108 kgCO2/year | 56 kgCO2/year |
| Dishwasher | 194 kWh/year | 99 kgCO2/year | 51 kgCO2/year |
| Kettle | 170 kWh/year | 87 kgCO2/year | 45 kgCO2/year |
| TOTAL | 2114 kWh/year | 1078 kgCO2/year | 560 kgCO2/year |
Adapted from: carbonfootprint.com
And with the UK having roughly 28 million households, it quickly becomes obvious how sensitive even a slight reduction in carbon intensity can be for the UK’s carbon footprint.
Fortunately, the UK has been reducing its carbon intensity of electricity significantly since 2013 and is now on par with the EU, as can be seen in the graph below, but we will look at this in more detail in the sections below.
Carbon intensity of electricity: UK vs Europe
The map below shows European countries and to their carbon intensity of electricity colour-coded into five different tiers, with the UK belonging to the 4th tier, which is the same as the EU average.
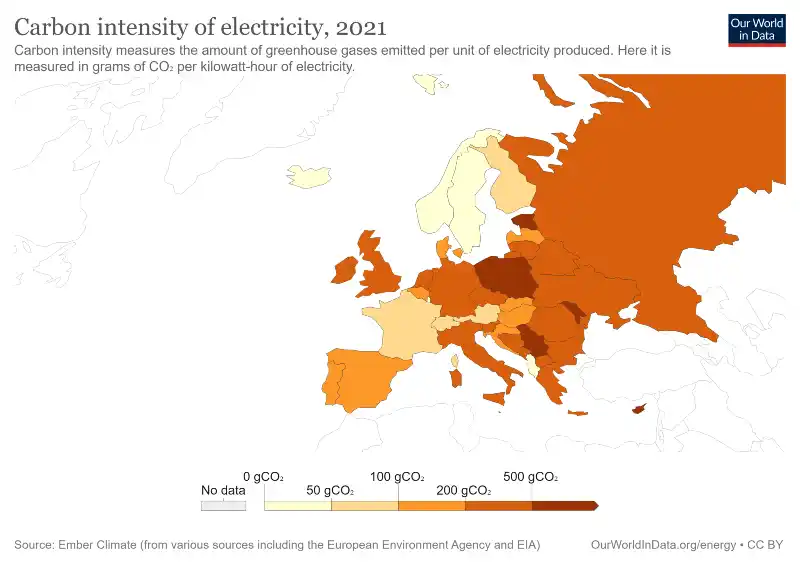
We have also compiled these in table form below to show the countries in each tier if you’re European geography is rusty. We have previously analysed the low-carbon electricity generation of Europe and the UK here, so we use our observations from there to generalise each tier in a European context:
| CIE Tier (g CO2 / kWh) | European countries | Characteristics |
|---|---|---|
| Tier 1 (<50) | Norway, Sweden, Iceland, Luxembourg, Albania | Small countries (population) with a long history of hydropower. |
| Tier 2 (50 - 100) | France, Switzerland, Austria, Finland | Nuclear-dependent countries with a range of renewables incl. hydro to support it. |
| Tier 3 (100 - 200) | Portugal, Spain, Belgium, Denmark, Latvia, Slovakia, Hungary, Croatia | Small/Medium-sized countries that are consistently transitioning. |
| Tier 4 (200 - 500) | UK, Netherlands, Germany, CZ, Italy, Slovenia, B&H, Montenegro, Greece, Bulgaria, Romania, Ukraine, Belarus | The typical European country that has historically relied on fossil fuels and is transitioning. |
| Tier 5 (>500) | Poland, Estonia, Serbia, Moldova | Ex-soviet countries unable to stop their dependency on cheap coal, oil and gas. |
Source: ourworldindata.org
And below is a graph of the CIE between 2000-2021, showing a country from each tier to generalize its typical profile, and see where the UK fits in:
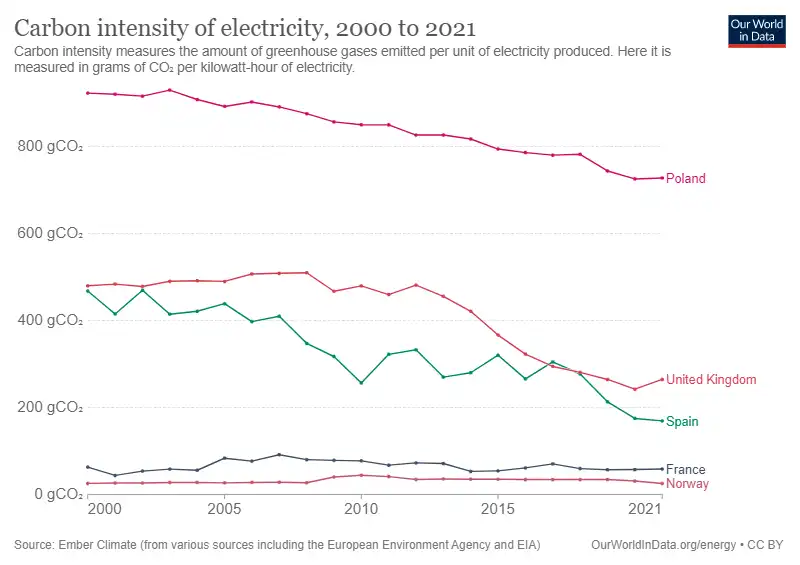
In conclusion, the UK seems to be rapidly decarbonising its electricity sector compared to other European countries but has so far only reached the ‘mid-table mediocrity’ of tier 4 countries.
On the bright side, Hinkley Point nuclear plant should become operational during this decade, and there are many wind farms under construction that should improve the CIE’s standing and bring it down one or two tiers before 2030.
Carbon intensity of electricity: UK vs World
Comparing the UK to some of the world’s most influential economies, it is safe to say that the UK’s carbon intensity of electricity is fairing well, especially with the aggressive roll-out of wind and solar electricity generation over the last decade.
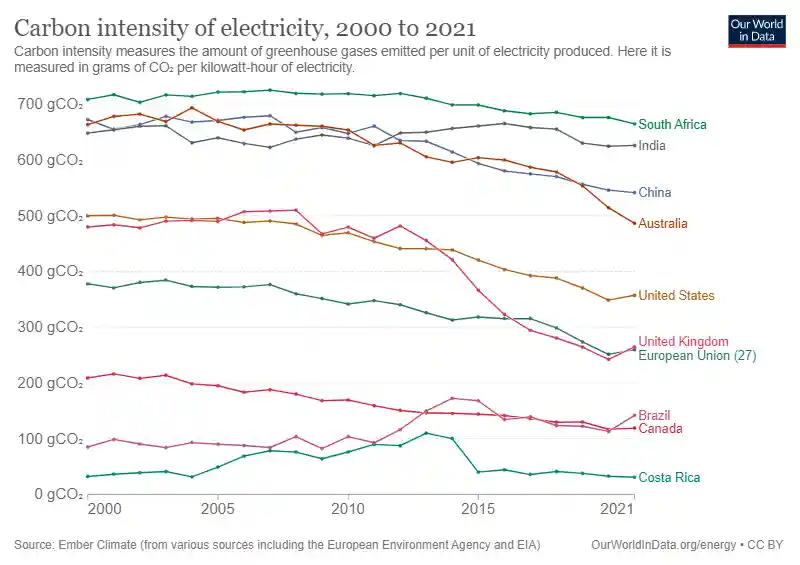
While its CIE used to be comparable to fossil fuel-rich US and Russia a decade ago, it’s now diverged down to meet the EU average while remaining significantly behind hydro-powered countries like Canada and Brazil.
At the same time, electricity is much greener in the UK than in its commonwealth counterparts of Australia and South Africa, despite being culturally similar(ish). Being a resource-rich country with significant oil & gas/mining lobbying has prevented them from decarbonising their electricity sector.
What is worrying from a global standpoint is the lack of reduction from the two most populous countries in the world: China and India. Nearly 35% of the world lives in these two rapidly-developing nations, but their carbon intensity of electricity is barely going down despite them being legally bound to net-zero by 2050.
This is not entirely their fault, as their gargantuan growth requires the equivalent electricity generation, with renewables arguably unable to scale enough until recently to meet their demand.
China already has the largest installed capacity of nuclear, hydro, wind, and solar by a long way, which it needs to meet its colossal industry and increasingly ostentatious population- they can’t entirely be blamed for wanting to catch up, and doing so with a vast array of low-carbon options.
Conclusion: The UK doesn’t suck
Globally, the UK appears to be doing better than the rest in decarbonising its electricity production and has seen one of the fastest reductions in the carbon intensity of electricity within Europe and the world over the last decade.
Running domestic appliances used to emit almost double the CO2 in 2008 than in 2021, and that is an impressive feat 13 years later.
This goes despite Brexit, Covid, political scandals and rising inflation rates, so there is definitely room to pat ourselves on the shoulders a bit, keep calm, and carry on with the energy transition.
Sources
- Share: