What’s the cheapest source of electricity?
The world needs to decarbonise its energy production to meet its 2050 net-zero goals. However, the world only has a limited amount of money to do so, which is why we have invented different ways of comparing which is the most cost-effective solution.
One of the main ways is by determining the LCOE (Levelised Cost of Electricity) of different energy technologies, which gives you the price per unit of electrical energy produced over the lifetime of any built electricity infrastructure (e.g. wind farms, solar farms, nuclear power station, etc).
We took on the mammoth task of aggregating some of the reputable LCOEs to decide which is the cheapest electricity solution to build.
We got a ranking, but frankly, little did we know how useless it actually is!
Let’s dive in.
Contents
- What is LCOE?
- Can we use LCOE to determine the cheapest energy tech?
- Insights from the LCOE aggregation
- LCOE over time
- Limitations of the LCOE
- Capital costs
- Key takeaways
- Resources
What is LCOE?
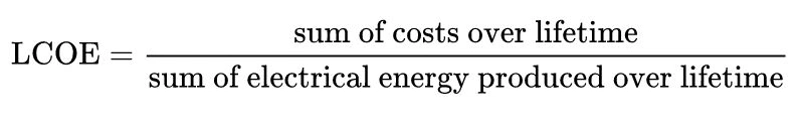
The Levelised cost of electricity (LCOE) is a measure of the average cost of generating electricity from a particular energy source over the lifetime of the infrastructure. Its units vary regionally, but in global comparisons, it is given in US dollars per MWh of energy produced over its lifetime (US$/MWh).
It was first proposed in the 1980s by researchers at the Electric Power Research Institute (EPRI) and is now a widely used method to evaluate the economic viability of power projects.
Can we use LCOE to determine the cheapest electricity tech?
The short answer is most definitely, NO.
LCOE calculations vary wildly (to say the least) and are subject to unmeasurable assumptions, uncertainties and interdependencies which we discuss in the issues with LCOE.
Nevertheless, we pushed through with our task and compiled LCOE values for each electricity technology from some of the most reputable annual LCOE reports we could find, and aggregated them to find the ultimate (and most generalised) LCOE figure.
We looked at the following reports:
- Lazard: One of the most reputable reports and includes multiple sources of electricity (We used the average of the max and min values).
- Ourworldindata.org: We gathered these LCOEs compiled from IRENA (International Renewable Energy Agency).
- U.S Energy Information Administration: These LCOES are for the U.S. but we decided to use them too; we just took an average of the most generalised values.
- UK BEIS: These LCOEs are for technologies installed in the UK, but we decided to include them too, converting GBP to USD at an exchange rate of 1.2.
- World Bank: We found that the World Bank had also calculated LCOEs recently and decided to include them.
To keep it very simple, we took a mean from the different LCOE values from the reports (often also a median or mean from a large range of values) and ranked them from the lowest LCOE to the highest:
NOTE: PLEASE TAKE THESE VALUES WITH A BUCKET LOAD OF SALT**
| RANK | MEAN LCOE ($/MWh) | |
|---|---|---|
| Onshore Wind | 1 | 43 |
| Hydropower | 2 | 54 |
| Solar PV - Utility Scale | 3 | 56 |
| Geothermal | 4 | 60 |
| Gas Combined Cycle | 5 | 67 |
| Biomass | 6 | 86 |
| Coal (With CCS) | 7 | 89 |
| Offshore Wind | 8 | 93 |
| Nuclear | 9 | 110 |
| Concentrated Solar | 10 | 120 |
| Battery Storage | 11 | 129 |
**See resources section for the individual LCOE values used for this calculation. .
Insights from the LCOE aggregation
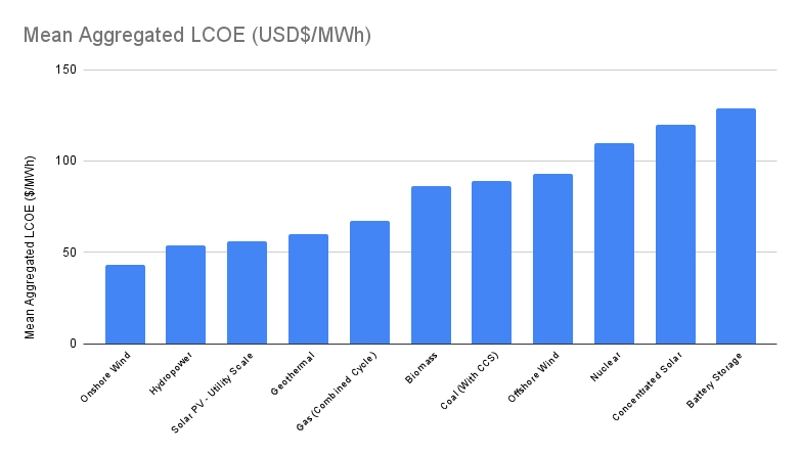
Our incredibly rough results confirm the general consensus that onshore wind and solar are now the cheapest sources of electricity, while battery storage is currently the most cost-prohibitive, explaining why there is still a big lack of electricity storage capacity to support the growing network of more fickle renewables.
Another surprising outcome of our aggregation is that hydropower and geothermal are incredibly cost-effective and perhaps more valuable due to their near-baseload capacities. However, fewer people in the media are covering it (please be aware that the internet is full of eco chambers, and the media has business interests behind its headlines).
Also, hydropower has come under much scrutiny due to its reliance on water supplies that are becoming increasingly unreliable due to climate change, while geothermal is likely a low-LCOE option only under very specific geological circumstances.

With the high media coverage of offshore wind farms being built in Northern Europe, we expected a low LCOE for this tech, but surprisingly, it was rated as one of the most expensive options.
Assuming the LCOE figures are representative of reality, we speculate that this is due to it only being competitive in certain regions like Northern Europe where:
- onshore space is lacking
- offshore wind resource is plentiful
- there’s a strong knowhow of offshore ops from the oil industry
- lobbying from offshore experts for the green transition
Finally, the aggregation indicates nuclear energy is deemed as one of the least cost-efficient options, which may explain why it is falling out of favour everywhere except in a few countries like China, despite it being currently the only tried-and-tested low-carbon baseload energy solution.
And as a footnote, concentrated solar is clearly the most expensive option for producing electricity and may find more utility in heat production for other applications.
LCOE over time
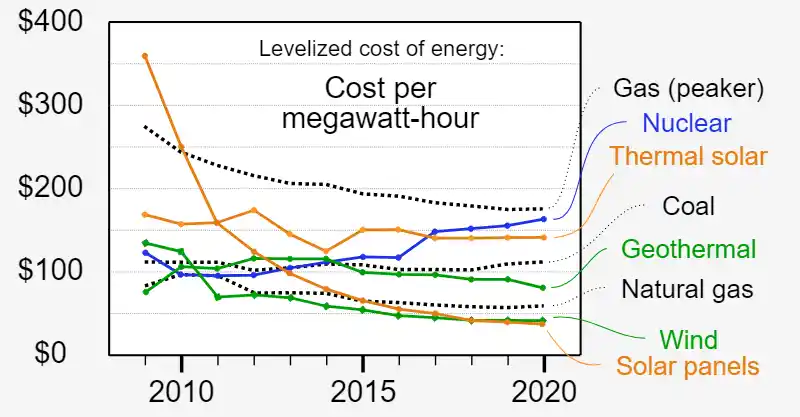
To complement the above, we decided to include this graph of how the LCOE of different technologies has been changing over time.
Clearly, renewables are becoming much cheaper over time as a result of economies of scale, accelerated innovation, subsidies and perhaps carbon premiums, while fossil fuels and nuclear are becoming more expensive and falling out of favour.
Limitations of the LCOE
In this article, we have aggregated and ranked LCOEs with incredible uncertainty levels. Given this uncertainty, we feel that it is actually MORE important to explain why LCOEs are not the only thing to consider when deciding which electricity tech will end up being the cheapest!
Where do we even start? Maybe from the beginning.
Capital costs

All projects have different capital costs with a variety of discount rates that will vary greatly over time. A 2020 sensitivity analysis by Lazard determined that the uncertainties within these discount rates can change the LCOE results by 6%-16%.
Also, the terms of loans will depend on the industry outlook, which is also changing. For example, new fossil fuel projects are paying a premium discount rate for their capital because investors take on the extra risk of a future carbon tax or the hefty cost of buying carbon from an ETS.
As long as climate change and ESG are around, the LCOE of any new fossil fuel projects will keep increasing against that of renewable energy projects.
Fuel costs
Nuclear, coal and gas power stations need to purchase fuel throughout their life span, and it’s impossible to predict exactly how these will change in the future.
Each LCOE calculation accounts for this uncertainty in a unique way, but the reality is that it is simply impossible to predict.
On the other hand, while wind and solar resources do not have a cost, climate change is making wind and cloud patterns increasingly variable, and there is no certainty that the expected wind and solar (cloudiness) resources will remain the same over the life span of the projects.
Wholesale electricity prices and subsidies

In an ideal market economy, the price of energy would perfectly mimic supply and demand.
However, in the real world, governments tamper with the energy markets artificially using subsidies, taxes and other incentives and prohibitions to deviate the energy prices from supply and demand.
This means that policy also adds another layer of uncertainty to LCOEs. For example, in the UK, the wholesale energy price is the same for all business energy suppliers, regardless if they purchased it from a gas power station or a wind farm.
The real value of electricity

Stemming from the same problem as above, the monetary price of energy does not always reflect its true market value.
Even though the LCOE tries to compare apples to apples by having a dollar cost per unit of energy, the reality is that energy has a different value at different times of the day and periods of the year.
Energy is of more value to society on a cold winter’s night to heat homes than it is on a mild summer’s day.
Baseload energy like nuclear and gas can be produced 24/7 and adjusted to meet demand, but this is not taken into account in the LCOE.
On the other hand, renewables are at the mercy of the season and weather and cannot always produce when energy is more valuable to society.
At least, until it is accompanied by appropriate energy storage, such as sand batteries and large-scale hydrogen storage, which are simply not tested or built yet (as is evident from the high LCOE of battery storage)
To include this value in the picture, the VALCOE was created (Value of the levelised cost of Energy), but we have not yet found any good VALCOE comparisons.
Other socio-political factors
We often see ourselves as rational beings, but this is often far from the truth: we have personal preconceptions and biases that blind us from taking objective decisions.
Many reject nuclear energy based on its hazardous preconception despite statistically being one of the safest energy sources, even if it’s currently the only baseload low-carbon alternative with hydro.
Many others oppose the notion of anthropogenic climate change and tend to see renewable energy as a symbol of values they stand against, so they actively oppose them despite showing the lowest LCOEs.
Others may be against onshore wind farms because of the visual pollution it causes to rural landscapes, despite it being literally the cheapest source of energy to build. For instance, the UK has contemplated banning them altogether, despite the available wind resource.
Capacity Factor
A power generation unit cannot be operational 100% of the time throughout its life span. In the case of baseload electricity requires maintenance and refuelling, while renewables depend on weather conditions.
The LCOE calculations take this into account using a capacity factor, but ultimately this is only an estimate which may not hold true over many decades, where fuel shortages, malfunctions and outright closure are always a possibility.
The future cost of carbon

As it’s becoming clearer with ETS (Emissions Trading Schemes) and carbon taxation systems, the energy industry is coming under increasing financial pressure to decarbonise.
Fossil fuel and biomass energy production will come under scrutiny, but there is no way of estimating what these costs will be like in the future.
On the other hand, renewable energy projects can emit carbon credits on the voluntary market and actually make additional money out of the “avoided emissions”, which many see as greenwashing.
Lack of consistency
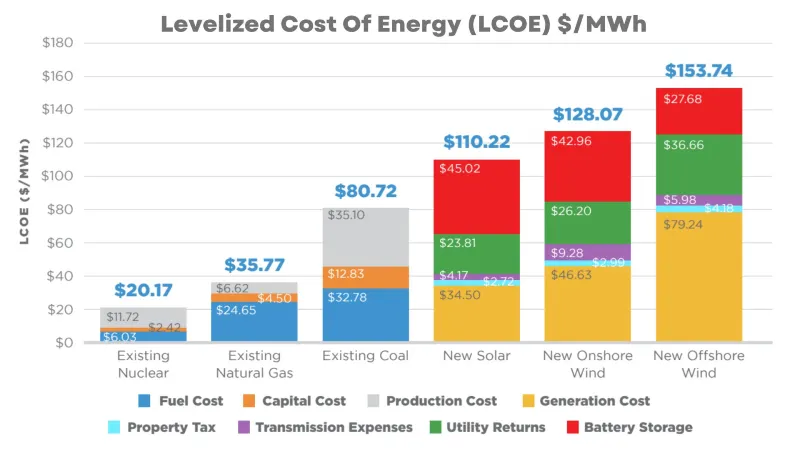
We decided to include this section last minute when coming across an obviously biased LCOE calculation on Twitter that showed a completely different set of costs and a very specific choice of energy technologies to include.
To be fair, the costs of battery storage are still huge (as is evident from our aggregation), and the costs of new transmission, property tax and utility returns should also be taken into account, but there has to be consistency in comparisons.
For example, this does not include the cost of new nuclear or fossil fuels (and we DO need new power generation as energy requirements are increasing) or the associated costs of continued pollution and, for nuclear, the extra premium for security.
The truth is that no LCOE will ever be perfect, and this graph shows how it can be grossly manipulated to push a particular narrative, very naughty but effective.
Other
There are so many significant variables that affect the LCOE variables that we cannot mention all of them, but others which are likely to have an impact and should be considered include:
- Network upgrades and transmission congestion.
- The rise of decentralised power generation.
- Nuclear Fusion.
- Smart Grids and how these can make renewable energy and storage work.
- Internet of Things that will enable the above.
Key takeaways
We set out to answer what the cheapest energy tech is using LCOEs and quickly realized the futility of our attempts.
Not only is the LCOE a very rough, easily manipulated number, but the reality is that changes in the future are impossible to predict with the fickle nature of global and government policy.
Our LCOE aggregation is concordant with general observations of what renewables are being deployed the most rapidly and may certainly guess the near future, but the ongoing pace in tech innovation and government lobbying will ultimately determine which energy tech ends up being the cheapest (and cleanest) in the future.
Ultimately, the goal is to reduce carbon emissions as fast as possible, so we prefer avoiding petty discussions over a meaningless LCOE and simply have governments that are focused on building as much low-carbon tech as fast as possible.
Resources
- Youtube – Engineering with Rosie
- EPRI
- OurWorldinData – Death rates per unit of electricity
- OurWorldinData – LCOE
- LCOE in Europe Report 2018 – European Commision
- Wikipedia – LCOE
- Lazard – LCOE report v14.0
- U.S. EIA
- UK BEIS – Electricity Generation Costs 2020
- Global Renewable LCOE – Kan, X et al., 2022
- World Bank – Demystifying the Costs of Electricity Generation Technologies, 2020
- Twitter – Alt LCOE
- Youtube – Kurzgezat
- InnovationNews
- NS Energy
- worldnuclear.org
- Investopedia
- Youtube – Thought Monkey
- Zurich.com
- IER
- dreamstime
- Aggregation of LCOE from the different LCOE reports:
| RANK | MEAN ($/MWh) | Lazard LCOE Report (2021) | IRENA (2022) | U.S Energy Information Administration (2021) | UK BEIS (2020) | World Bank Report (2020) | |
|---|---|---|---|---|---|---|---|
| Onshore Wind | 1 | 43 | 38 | 30 | 40 | 55 | 52 |
| Hydropower | 2 | 54 | - | 50 | 64 | - | 48 |
| Solar PV - Utility Scale | 3 | 56 | 36 | 50 | 41 | 52 | 51 |
| Geothermal | 4 | 60 | 75 | 70 | 38 | - | 56 |
| Gas Combined Cycle | 5 | 67 | 60 | - | 40 | 102 | 67 |
| Biomass | 6 | 86 | - | - | 90 | - | 81 |
| Coal (With CCS) | 7 | 89 | 109 | - | 82 | - | 75 |
| Offshore Wind | 8 | 93 | 83 | 80 | 105 | 68 | 130 |
| Nuclear | 9 | 110 | 168 | - | 81 | - | 82 |
| Concentrated Solar | 10 | 120 | - | 111 | - | - | 129 |
| Battery Storage | 11 | 129 | - | - | 129 | - | - |
- Share: